Finally got around to doing the rate of posting over the past year on a 10-post basis. That graph, which really shows how I go in spurts, can be found below. This is the total time between post n and post n+10 for n={2,12,22,...,562} (with the last one adjusted for the missing numbers) inverted and then graphed. Note that the index for the x-axis is for the last post, not the first post, in each group. (The posts are by group label rather than number, as inferred from n above)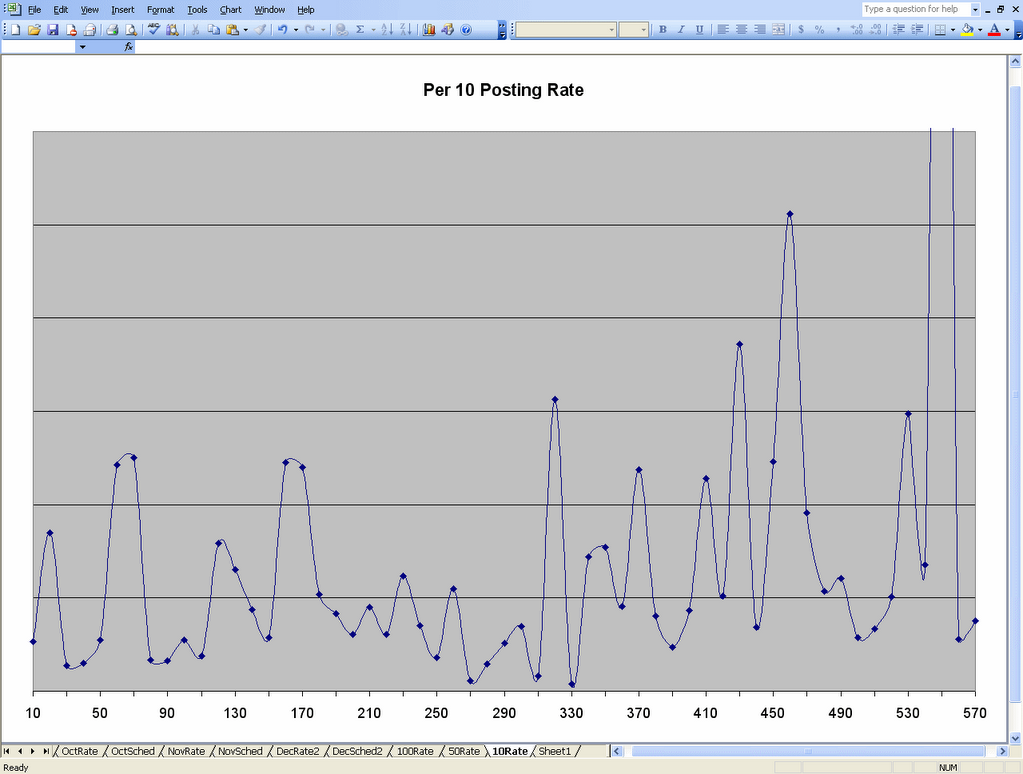
2006-12-12
The 10-rate graph
The 10-rate graph
2006-12-12T21:57:00-07:00
Feynman and Coulter's Love Child
Blog management|
Subscribe to:
Post Comments (Atom)


